Provis D3 - PROV-JSON visualisation tool (experimental)
Developed in the MBIE funded Innovative Data Analysis Research Programme
PROV-JSON {{ ' - ' + title }}
Index
-
- {{ child.name }}
{{ selectedItem.name }}
Type:{{ selectedItem.type }}
Attributes:{{ attribute.name }} - {{ attribute.val }}
none
PROV-N network visualisation
In the chart above, each activity, entity or agent contained in {{ title }} is represented by a small coloured circle. Prov-N defines different relations between these types objects. Relations are represented by the lines connecting the things in the relation.
In general, you can think of the arrows as pointing from the future to the past. So, for example, in PROV-N there is the relation wasDerivedFrom which describes how an entity can be derived from another entity. So, a grey arrow from entity a2 to another entity a1 means that a2 is a derivation of a1.
Sometimes in a PROV-N document, a relation, may refer to an activity, entity or agent that hasn't been defined in the document. In this visualisation, these things, which have been referred to but not defined, will be drawn as an white circle with a coloured outline.
The large circles with grey outlines represent components of the PROV-N document network. In the graph theory (the study of networks), a component is a set of nodes which are linked together in some way. This visualisation will draw each 'component' of a PROV-N JSON document inside separate circles.
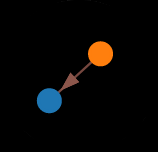
An agent 'was associated with' an activity.
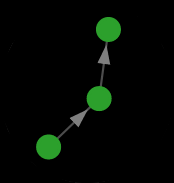
An entity 'was derived' from an entity which
'was derived' from another entity.
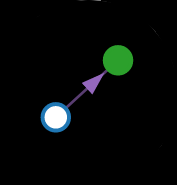
The activity used the entity, but the activity was never
declared on its own, so it has been coloured white.